
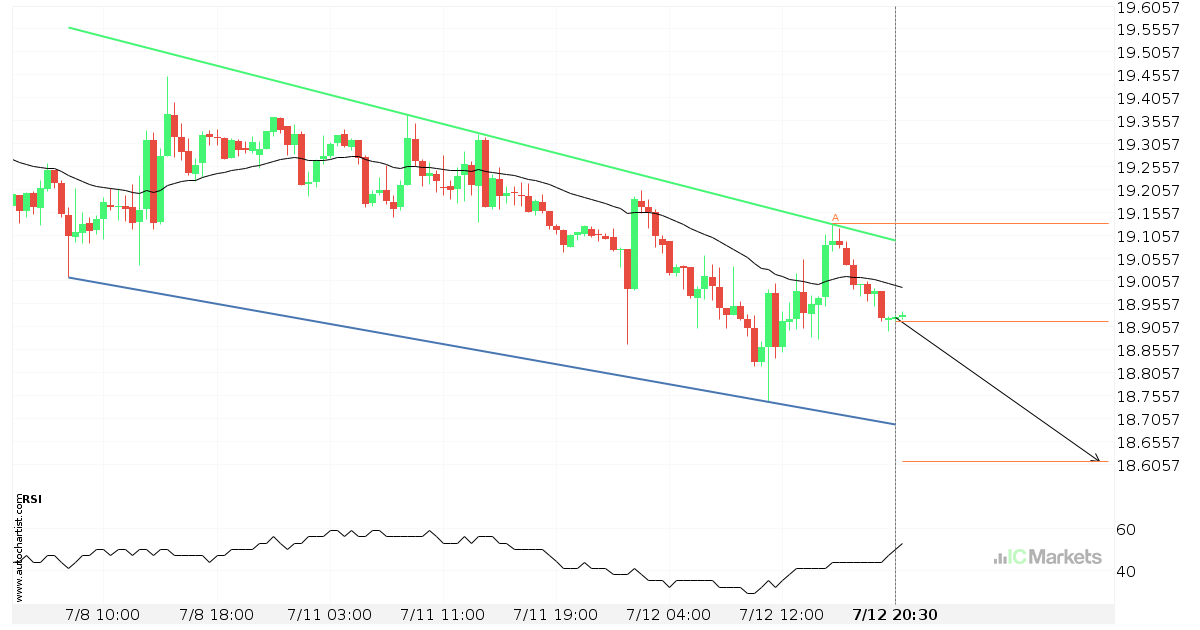
SILVER approaching support of a Canal descendente
SILVER is approaching the support line of a Canal descendente. It has touched this line numerous times in the last 5 days. If it tests this line again, it should do so in the next 18 hours.
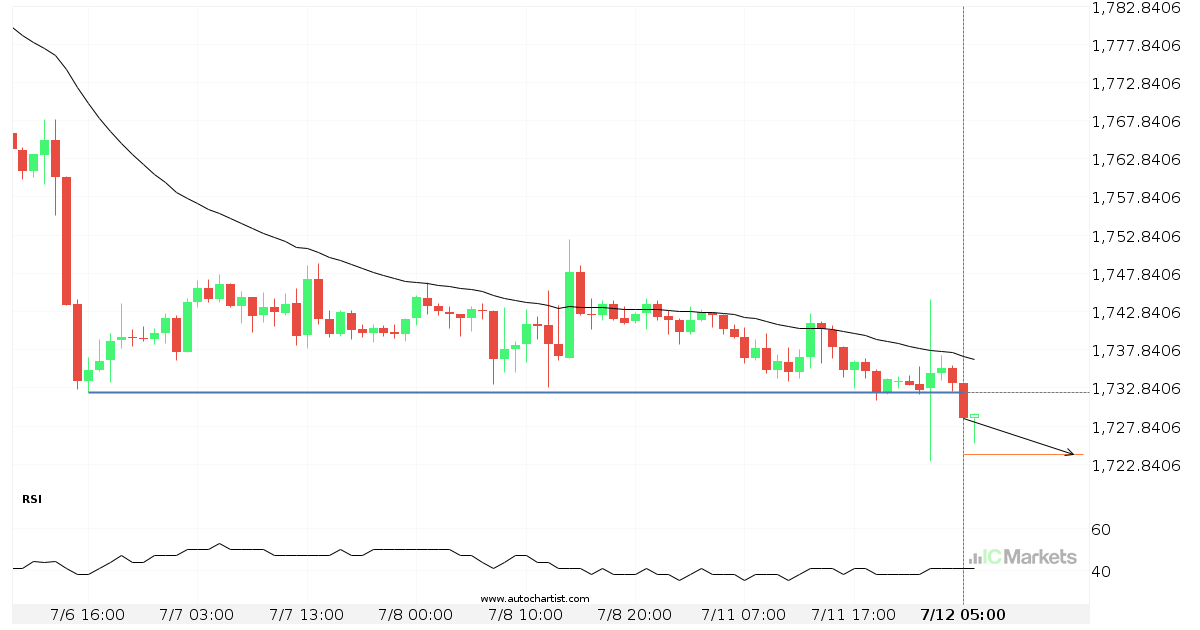
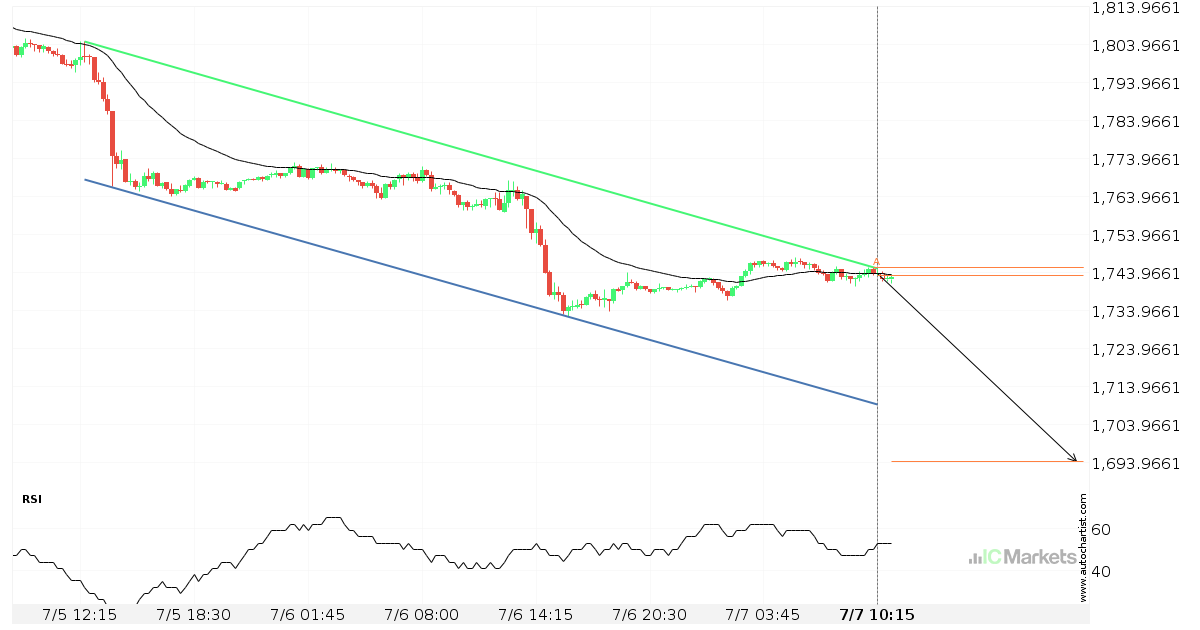
GOLD broke through important 1732.2500 price line
GOLD has broken through a support line. It has touched this line numerous times in the last 6 days. This breakout shows a potential move to 1724.1200 within the next 18 hours. Because we have seen it retrace from this level in the past, one should wait for confirmation of the breakout.
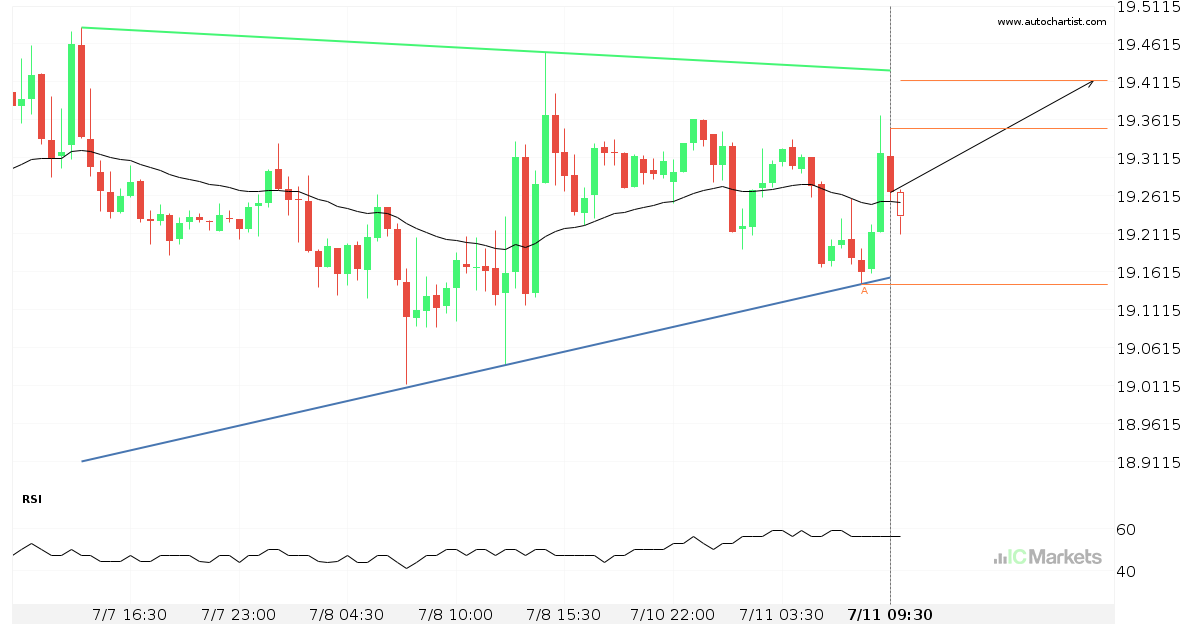
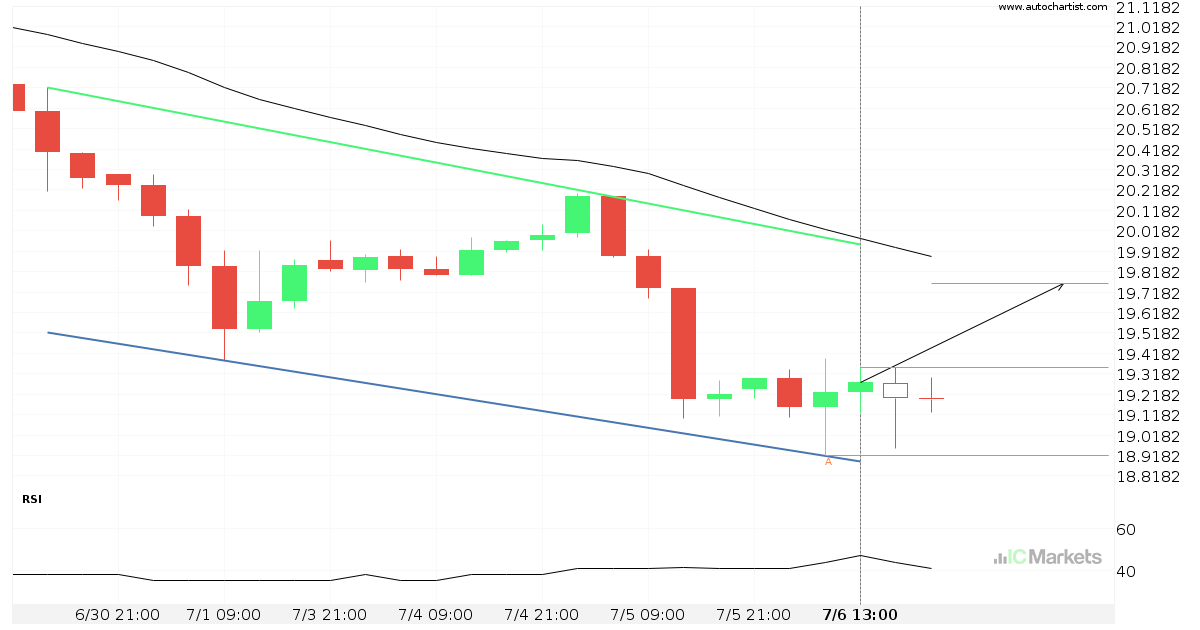
Either a rebound or a breakout imminent on SILVER
SILVER is heading towards the resistance line of a Triângulo. If this movement continues, the price of SILVER could test 19.4132 within the next 13 hours. It has tested this line numerous times in the past, so this movement could be short-lived and end up rebounding just like it did in the past.
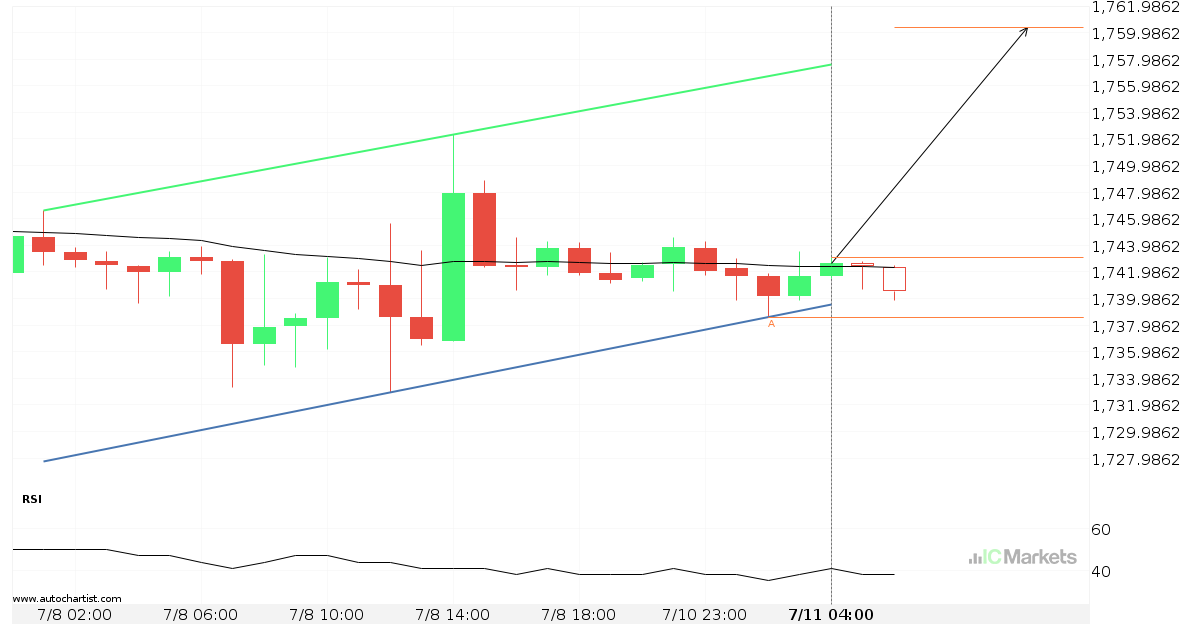
GOLD approaching resistance of a Canal ascendente
GOLD is approaching the resistance line of a Canal ascendente. It has touched this line numerous times in the last 4 days. If it tests this line again, it should do so in the next 5 hours.
GOLD – getting close to support of a Canal descendente
GOLD is moving towards a support line. Because we have seen it retrace from this line before, we could see either a break through this line, or a rebound back to current levels. It has touched this line numerous times in the last 2 days and may test it again within the next 13 hours.
Possible breach of resistance level by SILVER
SILVER is moving towards a resistance line which it has tested numerous times in the past. We have seen it retrace from this line before, so at this stage it isn’t clear whether it will breach this line or rebound as it did before. If SILVER continues in its current trajectory, we could see it […]
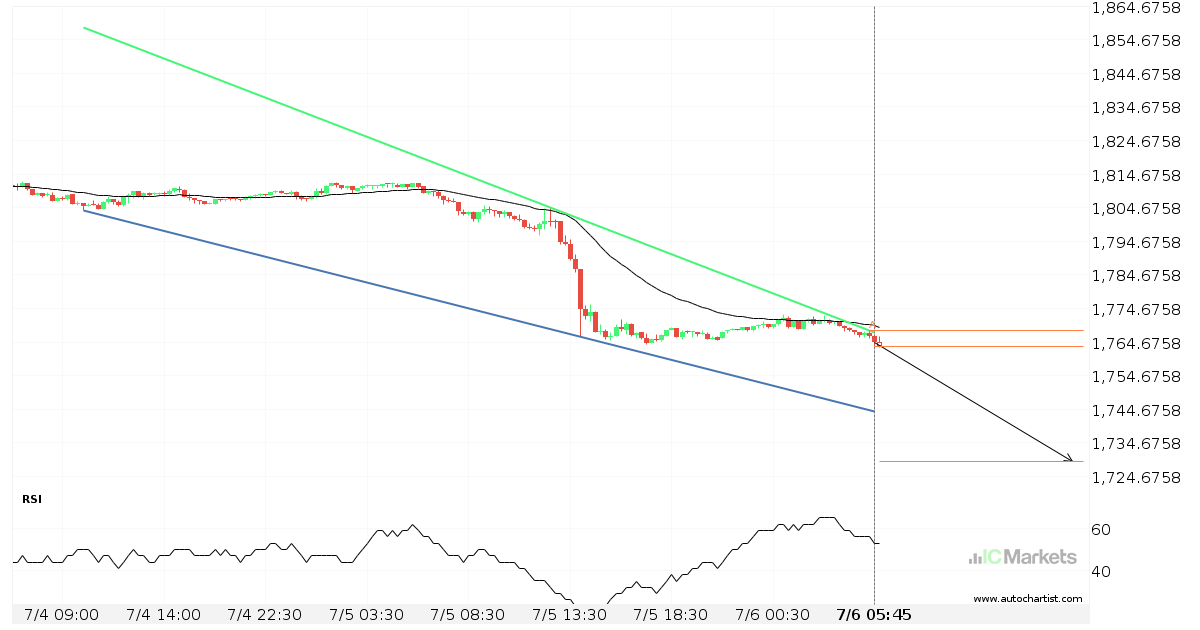
GOLD – getting close to support of a Canal descendente
GOLD is moving towards a support line. Because we have seen it retrace from this line before, we could see either a break through this line, or a rebound back to current levels. It has touched this line numerous times in the last 2 days and may test it again within the next 12 hours.
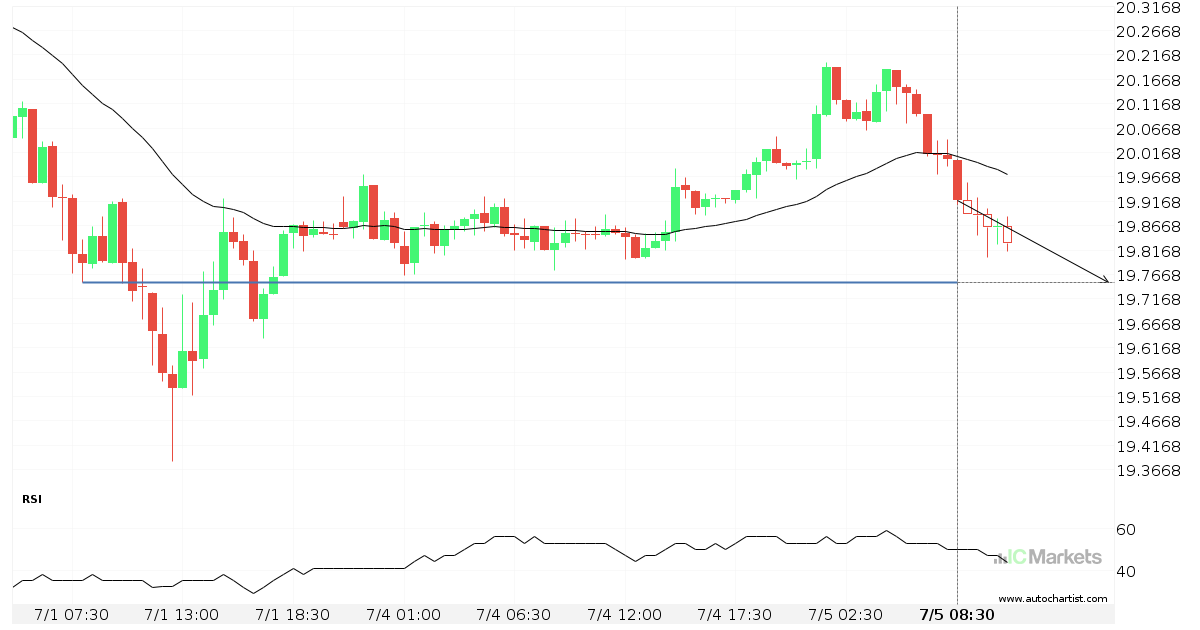
Either a rebound or a breakout imminent on SILVER
SILVER is heading towards a line of 19.7500. If this movement continues, the price of SILVER could test 19.7500 within the next 8 hours. But don’t be so quick to trade, it has tested this line numerous times in the past, so this movement could be short-lived and end up rebounding.
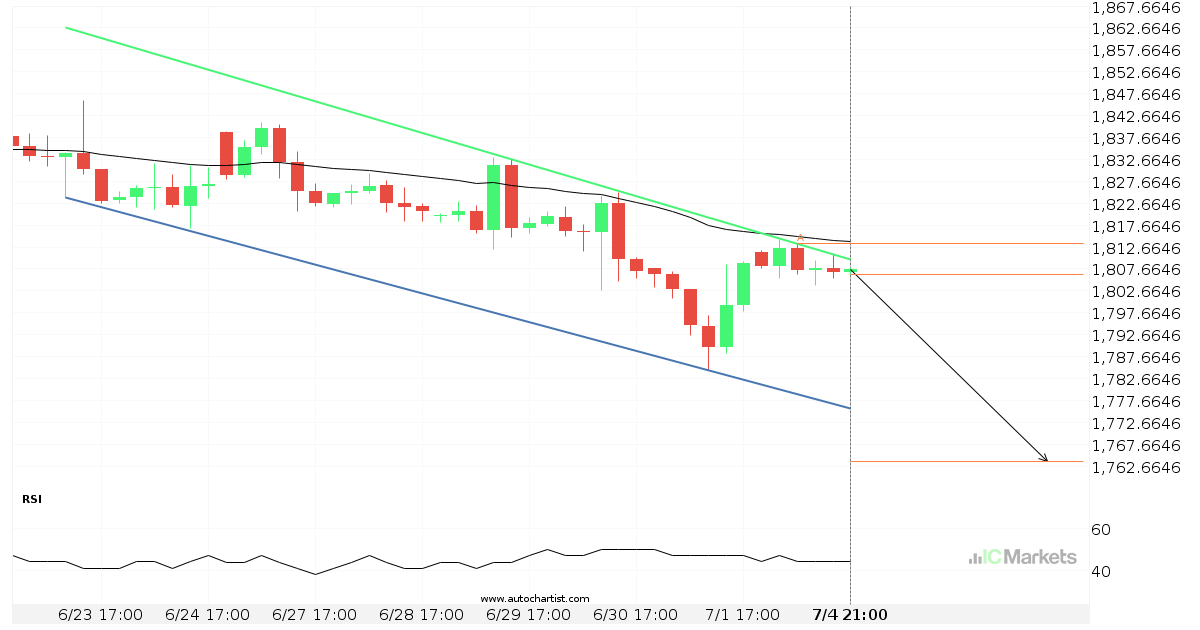
Either a rebound or a breakout imminent on GOLD
GOLD is heading towards the support line of a Canal descendente. If this movement continues, the price of GOLD could test 1763.7619 within the next 3 days. It has tested this line numerous times in the past, so this movement could be short-lived and end up rebounding just like it did in the past.
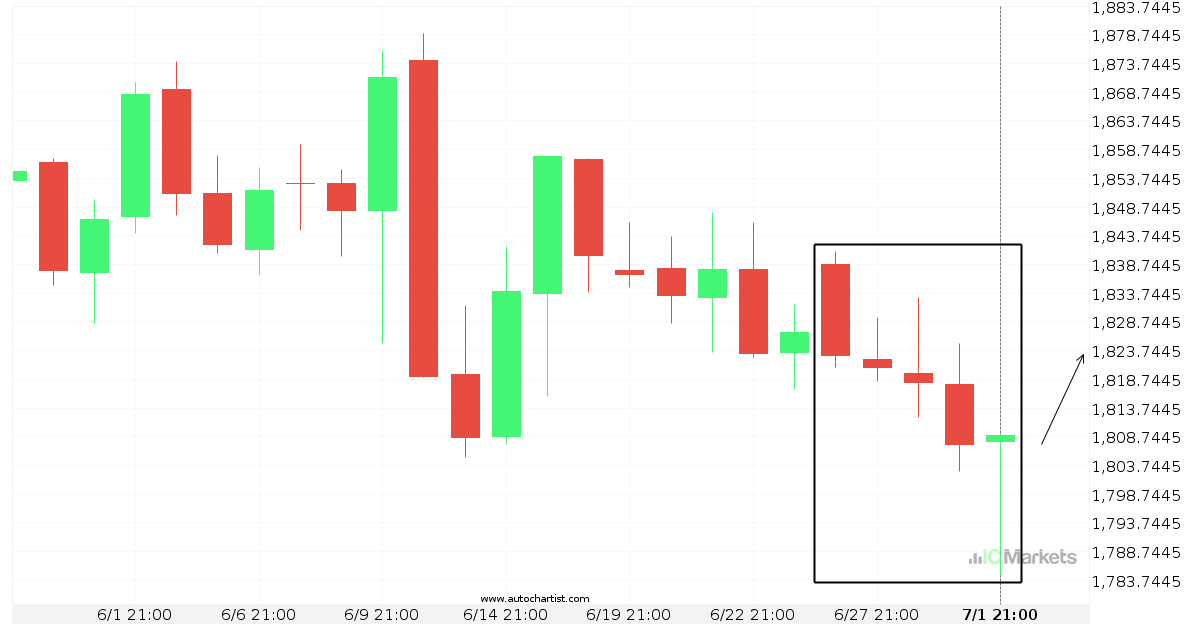
5 consecutive daily bearish candles on GOLD
GOLD has moved lower after 5 consecutive daily candles from 1838.8200 to 1807.3800 in the last 6 days.